Diagnostic/Formative Assessment
Introduction
Diagnostic and formative assessments are utilized daily in my classroom to monitor student's progress and drive instruction. Throughout this section, I will discuss how diagnostic Do Now activities lead our discussion each day. Additionally, I will illustrate the process I use to analyze data and plan instruction from formative assessments such as Exit Tickets and Weekly Quizzes. Each of these assessments is used to engage students in understanding and identifying top quality work that will help them achieve mastery on high-stakes testing.
Diagnostic Assessments
In my classroom, diagnostic assessments are used to drive discussion and instruction. Given the constraints of my curriculum at Achievement First, I have chosen to use Do Now and homework questions as diagnostic assessments. These types of assessments allow me to assess students before instruction and collect data on potential misconceptions in order to readily address them. Below are examples of student responses and various pre-planned question sequences to address anticipated misconceptions.
Do Now
Do Nows are a diagnostic assessment that I use to identify student's learning needs and develop appropriate learning experiences prior to teaching the lesson. By better understanding the skills students have prior to lesson delivery I am able to tailor my lessons to meet students where they are.
An example of a Think About It activity (also known as Do Nows) is highlighted. Students are prompted to spend the first 5 minutes of class attempting the problem independently. This has been a challenging skill to build when students lack confidence. However, through consistent messaging about this activity's diagnostic nature and positive reinforcement, students have been able to appropriately demonstrate their skills.
While circulating during this time, I evaluate student work to identify common misconceptions alongside exemplary work. These examples are highlighted under the doc-cam to spark discussion. An exemplary response is seen in Image 1 while a common misconception is seen in Image 2. By choosing to show a variety of responses I engage learners in understanding and identifying quality work and provide them with effect descriptive feedback to guide their progress toward that work.

The image to the left is an example of an exemplary response used to spark classroom discourse around mathematics. This student was able to model the portion of the leftover lasagna divided between three friends accurately. Additionally, they were able to explain their interpretation which demonstrates a conceptual understanding that is key for this lesson. This level of specificity gives all students the opportunity to identify top quality work.
The image to the right is an example of a common misconception that was observed during aggressive monitoring. This misconception allows students to see the most common mistake against an exemplary response in order to identify similarities and differences. For example, in this piece of student work, the student was able to accurately divide the model to demonstrate six pieces but was unable to identify the amount each piece represented. By placing this work against the exemplary work, our discussion is focused for students to identify the misconception, understand it, and apply their new understanding of fraction division equations.

Teacher Response to Diagnostic Assessment
After collecting data while students complete their Think About It, I have students analyze their own assessments so that they can create top quality work for their learning each day. To do this, I identify appropriate questions to guide a discussion. This may look different based on students' responses to the Think About It problem. An example of questions I select from can be found in the section on Apply Knowledge in Meaningful Ways.
For this example, I choose to take a poll for students to compare their thinking against others in the class. I chose to utilize the following question sequence to drive students to the key point.
-
Call a student who agrees with Image 2: Why do you agree with Image 2? SSS: I agree with Image 2 because they divided each part into three as the divisor tells us to do. Each piece of a third is 1/3 so 1/3 is the correct answer.
-
Take a second vote.
-
Call a student who disagrees with Image 2: Why do you disagree with Image 2? SSS: I agree with their modeling of the divisor. However, I disagree with their interpretation of the model. If you look at the model, it now has 6 pieces therefore 1 portion of that would be equivalent to 1/6, not 1/3.
Formative Assessments
In my classroom, formative assessments are used to collect data on the effectiveness of a given lesson. I have chosen to use Exit Ticket questions as formative assessments daily. These types of assessments allow me to alter our diagnostic assessment the next day in the Do Now in hopes of addressing pre-identified misconceptions.
While my primary use of formative assessment is through exit tickets, I also utilize aggressive monitoring to be able to track specific student progress. During a short crescendo push at the end of February 2019, this looked like identifying four focus students in each cohort (~16 students) to heavily track during class via a class tracker as well as after class. It was these student's work that I utilized when identifying misconceptions.
Another primary method of formative assessment includes weekly quizzes. At Achievement First students take a network-wide quiz to compare their progress against those of other students across the network. For me, this is important data to plan re-teach lessons in order to address misconceptions before unit assessments.
Exit Ticket
Exit tickets are utilized each day as formative assessment data. Students are assessed at the beginning of class during the Do Now as a diagnostic assessment but this data is only as important as the data collected at the end of class. Exit tickets allow me to see where students mastered the lesson and where underlying misconceptions are so I can take responsibility for aligning instruction and assessment with learning goals.
Exit tickets are taken in the last five minutes of class. Ideally, these occur after I have paused the class to address a misconception I observed during aggressive monitoring. Typically exit tickets include 2 to 3 questions but this may be modified to 1 depending on time. Below is evidence from exit ticket in Unit 11 Lesson 5.
SWBAT plot and identify coordinate pairs


Teacher Reflection
Today's lesson was approaching proficient. I noticed most students were able to understand coordinate grids but misinterpret the x-axis and the y-axis. As seen in the first image above, students were identifying and writing coordinate pairs with the y-axis first. This is inaccurate as seen when comparing to the second image, where the student correctly wrote coordinate pairs with the x value written first. Next time I teach this lesson I will utilize a brain tool to help students remember coordinate order.
"X comes before Y like X, Y, Z"
Unit 8 Weekly Quiz #4
On weeks that students are not given a unit assessment, they take a weekly quiz. While these assessments are to evaluate students performance based on standards they do not count towards their paceline. For this reason, their purpose is mainly to provide formative data to teachers and students prior to unit assessment. The performance and planning from these weekly quizzes are essential to help students achieve mastery of the four standards being taught and assessed each unit.
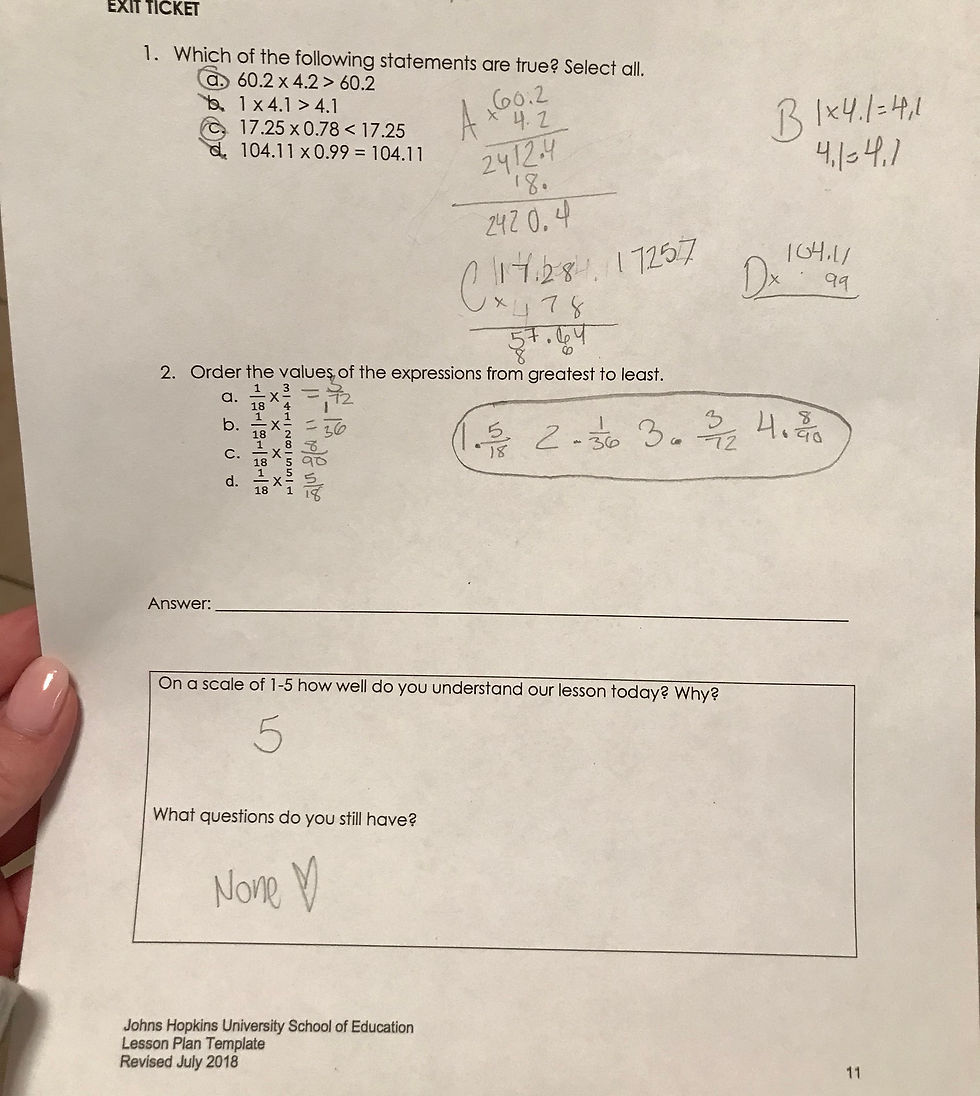
On each weekly quiz students completed 6 questions. While these are computer-based assessment, I rely on strong test-taking habits by enforcing scrap paper. An exemplary piece of scrap paper is shown below. This student neatly divided their paper into 6 components to provide adequate space to prove their answer choice. (This is a skill we heavily discussed while striving for accuracy).

The piece of evidence to the left exemplifies student learning. While all weekly quizzes are taken on student's Chromebook, it is important to establish strong habits of work. Student scratch paper is an important part of my data analysis in order to understand gaps in student's learning and plan meaningful instruction as seen in the evidence below.
The piece of evidence to the right is a modified weekly quiz used to appropriately assess all learners. Some modifications that were made to this assessment include annotations to alleviate any reading comprehension gaps, modeling to chunk two-step problems and paper-based rather than computer-based. Each of these modifications aligns assessments to this student's individual learning goals.

Big Picture
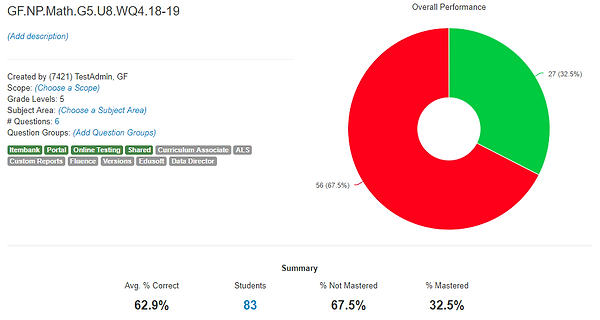
Shown below is data from Unit 8 Weekly Quiz #4. When beginning to evaluate student performance on this assessment I look at overall mastery then the performance by each question. While there is a breakdown by standard it is not aligned to every question and therefore does not provide insightful data as overall performance and question analysis.
The circle on this page demonstrate the percentage of students who mastered the content in green, students who are approaching mastery in yellow, and students who have not yet mastered in red.
Question Analysis
After looking at the overall mastery, I look at student performance on each question. By looking at the results of individual questions, I am able to identify trends in order to plan a re-teach for the following week. While looking at each question, I look carefully at students' scrap papers to identify misconceptions. According to this data, question 5 was the lowest performing. This question was a select all question which challenges student frequently. Matching this question type with standard 5.NF.6 (multiplication as scaling) which students have not yet mastered illustrated a need for re-teach.

Performance Analysis
After each weekly quiz, I complete a "stack audit" where I look at student work and data to evaluate strengths and weaknesses to driven instruction for the next week. As seen below, there are various components to the LASW track including evaluating last week's goal, identifying student exemplars, common errors from the quiz, an example of the gap, conceptual gap, teach-for-the-future statement, criteria for success, student exemplary, and goal percentage of mastery. By fulfilling this datasheet, I am able to reflect and goal set based on weekly quiz assessments. This allows me to establish micro-goals that can be maintained throughout a week of lessons.
Re-Teach Lesson
Based on this assessment analysis, it was observed that a re-teach lesson on 5.NF.6 with an emphasis on striving for accuracy was essential. For this reason, students engaged in a Chart the Error lesson where they looked at two pieces of work from Unit 8 Weekly Quiz #4. They discussed the differences of each pieces of work and the importance of striving for accuracy particularly when working with scaling factors. Below is the lesson plan and worksheet utilized from this assessment.

The images to the left illustrate students' responses to the reteach lesson. After intentionally planning to identify scaling factors, students utilized this skill to successfully complete this exit ticket. I purposely chose to include the box at the bottom of the page to develop learners ability to review and communicate their own progress and learning. This result of this has been an increase in student ownership over learning. This type of reflection also allows me to see how each student has perceived their learning which paints an additional layer of understanding that cannot be observed from restricting evaluating data.
Data Slide Week of February 12th
One way we use assessment data to invest students is through a daily data slide. At the beginning of each class, we look at our performance from the day before. I share my observations with students and allow them to set a goal for themselves for the day. Usually, this is based around fluency and/or exit tickets because it is tangible to students. The highlight of this classroom routine is the shout outs. After looking at various assessment data, I identify students who demonstrated mastery and growth. These students are shouted out and called on to name a strategy they used to find success.
Conclusion
As seen in the evidence above, diagnostic and formative assessments allow me to monitor student progress, engage students in their own learning, and improve instruction to be responsive to individual groups of students. By collecting data regularly and reporting this to students, students are able to evaluate their own learning. This level of consistent feedback provides more target instruction that allows students to close gaps quickly. This prepares students to tackle the demands of high-stakes testing.