Quantitative Evidence
Introduction
Every four weeks, my students take Unit Assessments created by Achievement First curriculum developers and specialists. Unit Assessments are computer-based tests that assess students procedural and conceptual understanding of four standards. Of these four standards, one to two may be spiral review while the remaining are new content from the corresponding unit. Using the data from these assessments, I am able to tailor instruction to ensure my students are on pace to make the dramatic academic success on high-staking testing at the end of fifth grade.
Overview of Unit Assessments
At Achievement First, Unit Assessments are standardized assessments administered on the computer. Students answer 16 questions - typically 14 of these questions are multiple-choice or select all and 2 questions are open-ended to assess both procedural and conceptual understanding of each standard. Additionally, structuring the assessments as such strives to mock the high-stakes testing students will take at the end of the year. All of the Unit Assessments are aligned to the end of year high-stakes Rhode Island Comprehensive Assessment (RICAS) and used to monitor students' of each standard. Unit Assessments are created by curriculum developers and specialists from the Achievement First Network who are also responsible for creating the unit plans and lessons provided to teachers.
Each Unit Assessment assesses four standards in mathematics. Typically one or two of these standards are part of a spiral review, which provides students with multiple at-bats of the same content. For this reason, I am given multiple data sets to monitor students' progression and adjust my instruction accordingly.
In order to view student's learning as a continuum, Achievement First Greenfield uses paceline reports to monitor the amount of standards students are passing in order to monitor their progress towards fifth-grade mastery and sixth-grade preparation. The growth seen in the data below demonstrates that I am providing my student with the knowledge and skillset to achieve at higher levels.
Sample Unit Assessment
In order to look further at Unit Assessment, this section will dissect the standards, questions, and rubrics from Unit Assessment 11. The computer grades all multiple choice and select all items while teachers grade open response questions. Although there is variance in the points a student can receive based on the open response question, it is most common for students to be eligible to receive one point for demonstrative their critical thinking and another for its accuracy.
Shown in the PDF below is teacher facing resource which provides examples of top quality work, answer keys and grading criteria. This resource contains the answers for each multiple-choice question as well as the criteria for each open response question. This resource is important to use during my grading to ensure I am aligning my scores to all assessors in the network in order to provide equitable feedback that helps all leaders, teachers, and students best prepare for high-stakes testing.
Scoring Unit Assessment
More specifically, Unit Assessments are scored in Illuminate Education, a software Achievement First uses for all internal assessments to collect data, compare schools and districts, and monitor students progress towards grade-level mastery. It provides insight on students mastery of a standard. The image below is an example of a matrix report (students names and data are artificial) that demonstrates the scoring of student's assessments. As sene in the image below students are evaluated on their performance per question. Multiple choice questions earn student one point while open response questions can earn students one to six points depending on complexity. When students earn all possible points for a question the box appears green. If a student does not earn the points for a question the box appears red with the student's answer choice. In the first box to the right of the student's name is their overall mastery.

Seen in the red box above is how the matrix analyzes students' performance on a standard. Each Unit Assessment assesses students on four standards. Students demonstrate mastery by answering four questions per standard. Students must answer three out of four questions to earn the mastery of that standard on their paceline report.

The image above shows students progression toward individual standard mastery. When students have mastered a standard, as outlined in Image 1, the percentage of questions they answered correctly will appear in green. If students have not mastered a standard, the percentage of questions they answered correctly will appear in red. Standards that appear in green count towards students paceline as discussed in the following section.
Data and Analysis
The data for Unit Assessment is tracked by Achievement First Network, Achievement First Providence Mayoral Middle School, students and families in their paceline reports. For these reports, there are "cut-offs" that indicate a number of standards students need to master to demonstrate adequate progression throughout the year. On each Unit Assessment students have the opportunity to master four standards. There are three "cut-off" bands that categorize students as advanced, proficient, approaching proficient, or not proficient. These cut-offs increase after each Unit Assessment to account for new information. Throughout this section, students progress from Week 5 (after Unit Assessment 1) through (Week 42 (after Unit Assessment 11) will be noted and analyzed.
Whole Group Data
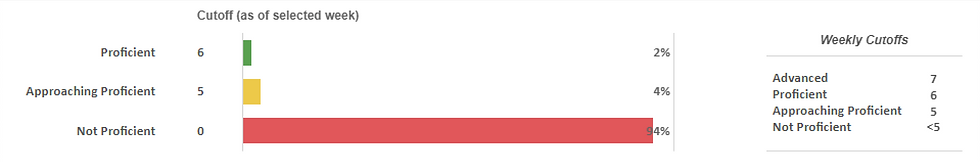
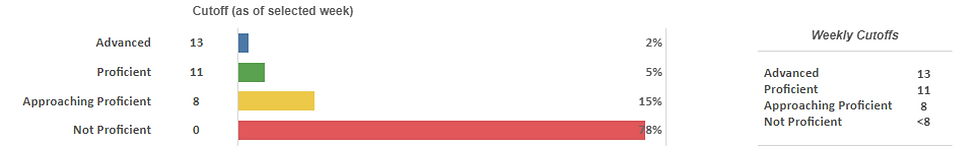
Seen in the image below is the percentage of students who fall in each bandwidth at Week 5, Week 13, Week 27, and Week 42 (last week of school). In the first image, 94% of students demonstrated mastery on less than five standards. If students were to continue at this rate they would not have demonstrated the dramatic academic growth necessary. When looking at student data it was important to alter instruction that would support student growth. From this point, I choose to incorporate more review games and homework packets that provided students with more at-bats. The impact of this was evident when 16% of students moved up from the not proficient band. Even with this growth, I knew it was not enough. I continued to alter my instruction to incorporate more partner work, develop family relationships to encourage continued learning at home, assess my own teaching of skills with my regional superintendent, and participate in crescendo (a six week intensive review period before standardized testing) to help students grow. Ultimately, the 2018-2019 academic year concluded with only 19% of students not proficient in mathematics. From September 2018 to June 2019, students grew from 6% proficiecny to 81% proficiency demonstrating dramatic academic growth.

Class by Class Data
Noted in the previous section was the tremendous growth fifth-grade students at Achievement First Providence Mayoral Middle School made throughout the 2018-2019 school year. To gain further insight, it is vital to look deeper at the progress each class made. This cohort has three classes of students who referred to themselves by the colleges they were named after; Brown University, Providence College, or the University of Rhode Island. Each class has different class cultures that attribute to their respective data. As an educator, it is critical to tailor my instruction to these differences.
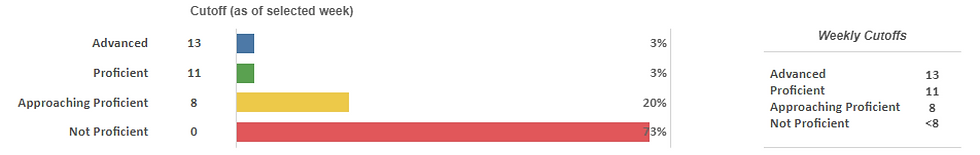
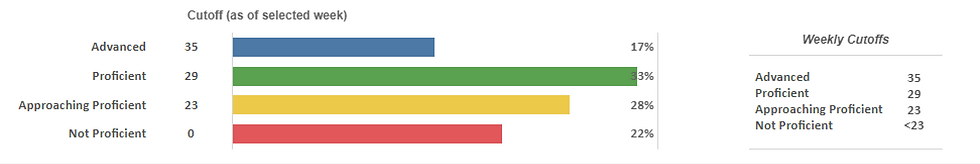
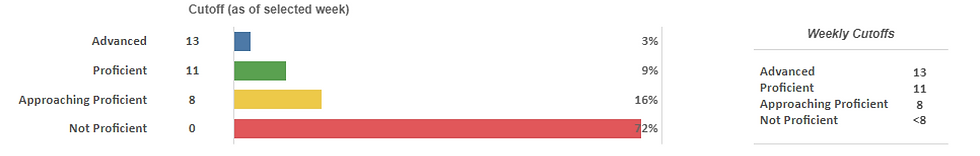
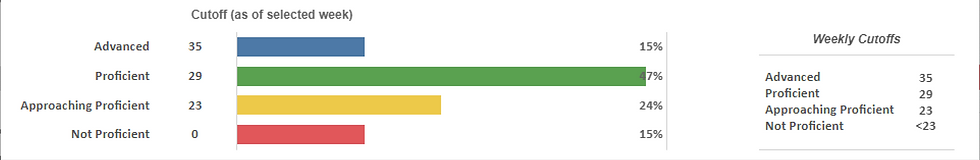
For this reason, I made it a point to look at each class data individually. Each classes growth can be seen in the images below. For this data, I am looking at student moving from the red (not proficient) to any level of proficiency. As you will see in the images below, students are demonstrating dramatic academic growth over time. In Brown University, students moved from 100% not proficient in Week 5 to 88% not proficient in Week 13 to 67% not proficient in Week 27 and 20% not proficient in Week 42. In Providence College, students moved from 93% not proficient in Week 5 to 73% not proficient in Week 13 and Week 27 to 22% not proficient in Week 42. In the University of Rhode Island, students moved from 88% not proficient in Week 5 to 72% not proficient in Week 13 to 53% not proficient in Week 27 and 15% not proficient in Week 42. Each of these classes has demonstrated dramatic academic growth by reducing the number of students who are not proficient to less than 25% per class by the end of the 2018-2019 academic year.
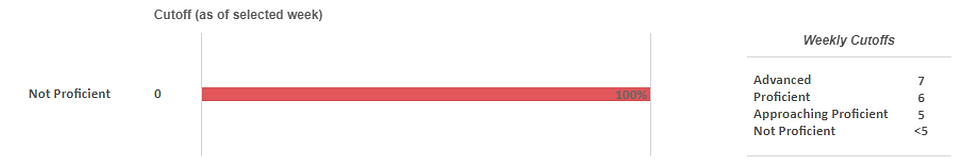


Brown University
Providence College
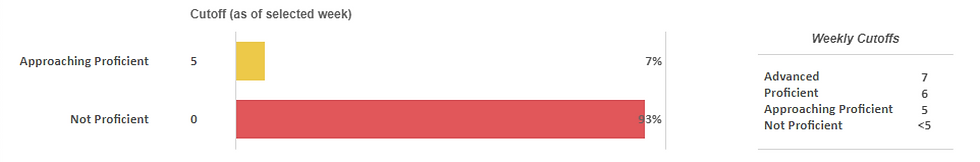
University of Rhode Island

Individual Examples of Dramatic Academic Growth
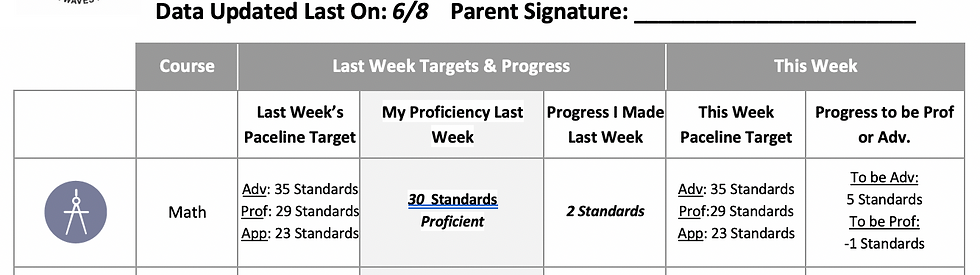
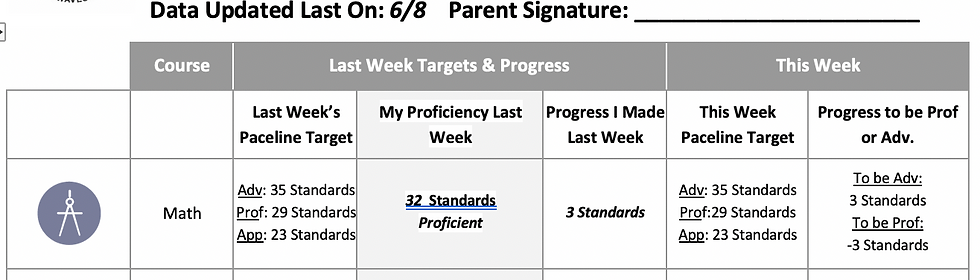
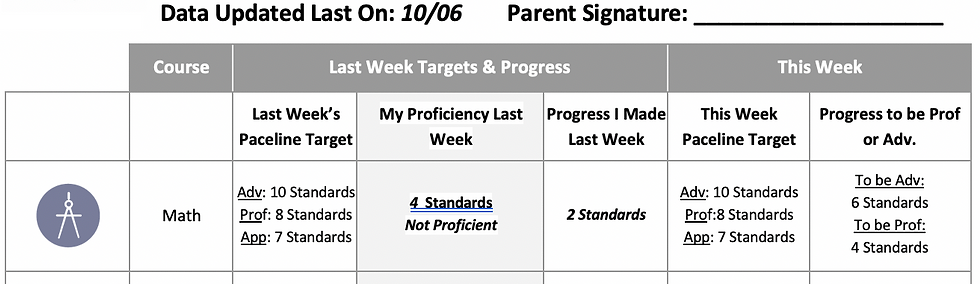
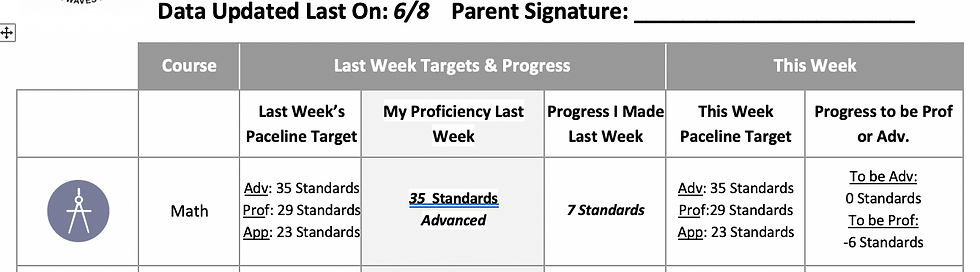
Featured in this section are three examples of individual dramatic academic growth. For each student, there are pictures from their paceline report. Paceline reports are the weekly progress reports used in the Achievement First Greenfield Model to update families on their child's progress in all courses. One column annotated the cut off scores students need to fall in each benchmark for the past week and another column annotated those values for the current week. In the middle each student's current proficiency level. Student 1 grew from demonstrating mastery of one standard (Not proficient) in Week 5 to 30 standards (Proficient) in Week 42. Student 2 grew from demonstrating mastery of two standards (Not proficient) in Week 5 to 32 standards (Proficient) in Week 42. Student 3 grew from demonstrating mastery of four standards (Not proficient) in Week 5 to 35 standards (Advanced) in Week 42. All three of these students demonstrated dramatic academic growth moving from not proficient to proficient or advanced. Being proficient or advancaed demonstrates readiness for 6th-grade math.
Student 1

Student 2

Student 3
Conclusion
As an educator, it is my duty to ensure my students are making dramatic academic growth to be prepared for their future both in regards to academics as well as 21st-century skills. By utilizing Unit Assessment data and paceline reports, I am able to monitor my students progress and thereby provided targeted instructions based on misconceptions or gaps in their learning that could inhibit them from success on high-stakes testing and/or future opportunities. With this intentionalism, my students grew from 6% proficiency to 81% proficiency demonstrating dramatic academic growth during the 2018-2019 academic year. I must continue this practice of utilizing quantitative data to inform and reform my instructional practices in ways that best support the students I have in from of my in an effort to negate the achievement gap that currently resides in many urban communities.